
Distribution KPIs turn sales, inventory, warehouse, purchasing, supplier, and financial data into signals. They show where the bottlenecks are. But more metrics aren't better. The right ones tie to a decision, an owner, and a business outcome.
This article lays out a focused scorecard of seven KPI groups and how to run it.
Key Takeaways
- Track KPIs across service, accuracy, availability, profit, cash, and supplier reliability.
- Define every KPI the same way: period, numerator, denominator, exclusions, source.
- Segment results by product, customer, salesperson, warehouse, supplier, channel, and carrier.
- A connected ERP and live dashboard cut spreadsheet work and speed up action.
Overview of Distribution KPIs in the U.S. Wholesale Distribution Market
APQC defines a KPI as a specific measure used to gauge a quantifiable component of organizational performance. In distribution, that means a number tied to one slice of commercial, warehouse, inventory, supplier, delivery, or financial performance.
Durable-goods distributors need a balanced set because the pieces depend on each other:
- Stock availability drives sales.
- Fulfillment errors erode customer trust.
- Excess inventory consumes cash.
- Slow collections limit purchasing capacity.
Leading vs. lagging indicators
ASCM separates lagging indicators, which record outcomes, from leading indicators, which aim to predict them. Backorder rate, supplier lead time, and quote conversion are leading. Gross margin, customer complaints, and operating profit are lagging. Watch both: leading measures give you time to act, lagging ones confirm whether you did.
The measures below connect daily activity to customer experience, working capital, profitability, and supplier decisions.
Top Distribution KPIs for Distributor Performance
Each KPI here meets four tests: it comes from normal distribution data, ties to something you control, helps a specific role, and makes sense next to related metrics.
On-Time-In-Full Delivery
APQC defines OTIF as the percentage of orders delivered complete within the agreed time. That definition is order-based. Decide up front whether you measure by order, line, unit, or shipment, because the results aren't interchangeable.
Order-based formula: orders delivered on time and complete ÷ total orders × 100.
Split misses into late versus incomplete. Late orders point to carriers, routing, or warehouse timing. Incomplete orders point to inventory availability or purchasing.
Segment by customer, route, warehouse, carrier, and product category. Persistent misses for one customer are a retention risk.

Perfect Order Rate and Order Accuracy
Perfect order rate combines several conditions: right product, right quantity, on time, damage-free, and accurate documentation. SCOR's formula is perfect orders ÷ total orders × 100. Order accuracy is narrower. It asks only whether the customer received what was ordered.
How they differ:
- Perfect order rate: every service condition met
- Order accuracy: customer received what was ordered
- Picking accuracy: warehouse picks match the order
- OTIF: on time and complete, nothing about damage or paperwork
Use error codes to find root causes: mis-picks, shipping damage, pricing or documentation errors, and customer returns. A pile of pricing errors is an order-entry problem, not a warehouse one. Fixing the wrong department wastes months.
Order Fill Rate and Backorder Rate
APQC publishes several fill definitions, and the denominator matters:
| Measure | Calculation |
|---|---|
| Order fill rate | Completely filled orders ÷ total orders |
| Order-line fill rate | Completely filled lines ÷ total lines |
| Unfilled lines | Lines unfulfilled due to unavailability ÷ lines placed |
Pick one, state it, and stay consistent. Read fill rate and backorder rate together.
A falling fill rate or rising backorders can signal weak forecasting, inaccurate inventory records, supplier delays, or a stocking policy that no longer matches demand. Review by SKU, supplier, customer, and location to find which one.

Inventory, Margin, Cash, and Supplier KPIs
Inventory Turnover and Days Inventory Outstanding
- Inventory turnover = annual COGS ÷ average inventory
- DIO = average inventory ÷ annual COGS × 365
APQC calculates turns from annual COGS and average month-end inventory. DIO equals 365 ÷ turns only when valuation and averaging are consistent. They are two views of one relationship: turns count cycles, DIO counts days.
Higher turnover isn't automatically better. Push it too far and you get stockouts, lost sales, and costly emergency replenishment. Review slow-moving, obsolete, seasonal, and high-margin inventory separately before changing purchasing or stocking policy.
Gross Profit Margin by Product and Customer
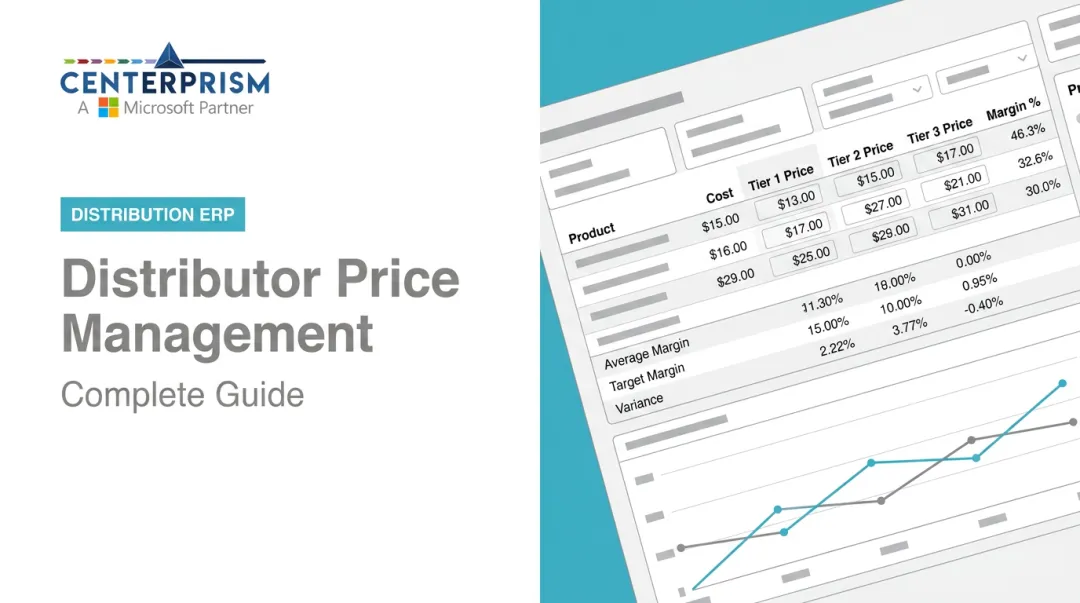
Gross margin percentage = (sales − COGS) ÷ sales. The company-wide figure hides a lot. Where cost data is reliable, analyze it by SKU, product family, customer, salesperson, and transaction.
Then trace the leaks:
- Pricing and freight recovery
- Discounts and rebates
- Supplier costs and special orders
- Customer-specific contracts
NAW materials also point to cost-to-serve and vendor cost supports as profit drivers. Revenue growth can hide weak profitability when your biggest accounts or products earn too little.
Days Sales Outstanding and Cash Conversion
APQC's DSO formula is average gross accounts receivable ÷ gross annual sales × 365. Don't mix sales bases between DSO and receivables turnover. The cash conversion cycle adds it up: DIO + DSO − DPO.
NAW/MDM notes that a long cycle ties up cash in inventory and unpaid invoices. Finance and sales can use DSO to spot overdue accounts, weak credit terms, disputed invoices, and collection bottlenecks.
Segment by customer, salesperson, payment method, and aging bucket, and keep sensitive customer detail limited to those who need it.
Supplier On-Time Delivery and Receiving Accuracy
Track supplier performance across:
- On-time delivery against the original commit date
- Purchase-order completeness
- Lead-time reliability
- Receiving accuracy (product and quantity match the order)
SCOR's supplier reliability measure also includes complete, accurate documentation and damage-free receipt.
Weak supplier trends ripple outward: more backorders, higher safety stock, broken customer promises, and extra receiving labor. Build scorecards that separate supplier-caused delays from internal receiving or data-entry errors. Otherwise you'll penalize a vendor for your own mistake.

How We Chose the Top Distribution KPIs
We favored KPIs that connect directly to distributor outcomes over those that are merely easy to report. The common failure is tracking too many measures with no owner and no defined response. MIT Sloan research notes that many organizations don't get the intended value from their KPIs.
Document each KPI:
- Formula and data source
- Owner and reporting frequency
- Target or baseline
- Acceptable exceptions
- Required action when results leave the expected range
Review KPIs in pairs. Fill rate belongs next to backorders and turnover. Gross margin belongs next to sales volume and discounts. Otherwise you improve one number and damage another.
Use role-based reporting. Executives watch a short scorecard. Warehouse, purchasing, sales, and finance leads need the drivers underneath.
Why integrated data matters
Spreadsheets invite inconsistency. Panko's spreadsheet error experiments found formula-cell error rates of 1.1% to 5.6% across nine experiments. Those are lab results, not a distributor error rate, but they show why hand-built KPI reports deserve suspicion.
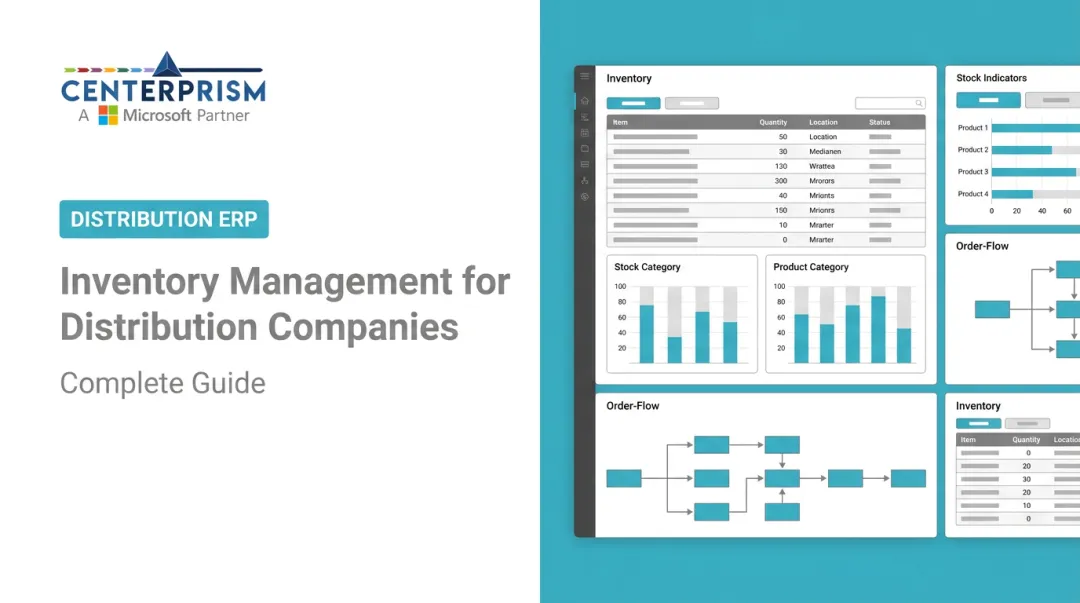
An ERP where orders, inventory, pricing, purchasing, and sales share one database gives everyone the same definitions. Centerprism's PrismView connects live to the Dynamics GP database with no separate database, and supports filtering, grouping, drill-down, and saved views. Teams move from reviewing last month to correcting this week.

Conclusion
Revenue and profit alone won't explain distributor performance. Service reliability, availability, accuracy, supplier execution, margin, and cash collection have to be read together.
Start small:
- Pick a manageable set of KPIs.
- Establish consistent definitions.
- Assign owners.
- Set a baseline.
- Review trends before adding more.
If you run a small or mid-size durable-goods distributor, evaluate Centerprism's distribution ERP and PrismView analytics. They deliver connected, real-time visibility across sales, inventory, purchasing, orders, and finances.
Call 1-800-814-6631 or email info@centerprism.com.
Frequently Asked Questions
What are the key performance indicators (KPIs) used in distribution?
Distribution KPIs cover service, inventory, warehouse, supplier, sales, profitability, and cash flow. Common examples are OTIF, fill rate, inventory turnover, gross margin, and DSO.
What are the 5 key performance indicators in logistics?
Widely used ones are on-time delivery, order accuracy, order cycle time, fill rate, and inventory turnover. The best five depend on your goals.
What are KPIs for suppliers?
Supplier on-time delivery, delivery completeness, receiving accuracy, and lead-time reliability. Add defect or return rate and purchase-order cost variance where relevant.
Which KPIs should a distributor track daily?
Orders awaiting fulfillment, fill rate, backorders, on-time shipments, inventory exceptions, and urgent supplier or customer-service issues. Cadence is a judgment call based on your volume.
How do you measure distributor performance?
Use a balanced scorecard: customer service, order accuracy, inventory efficiency, supplier reliability, sales margin, receivables, and cash conversion.
What is the difference between fill rate and on-time-in-full delivery?
Fill rate measures whether demand can be supplied from available stock. OTIF measures whether the promised order arrives both on time and complete.